News Online
  • Home
  • Economy
  • Featured
  • Industry
  • Law Update
    • Business
    • Family & Personal
    • Market
  • Market
  • Tech
Category:

Industry

Industry

Strategic Treatment Allocation: Maximizing Clinic Returns with High-Demand Skin Rejuvenation Programs

by Brandon July 16, 2026
written by Brandon

Why a framework matters for clinics and practitioners

When you run a dermatology or medical-aesthetics practice, the choice to expand or prioritise skin rejuvenation treatment offerings isn’t just clinical — it’s strategic. A clear framework helps you balance patient outcomes, equipment investment, and scheduling efficiency so that both clinical quality and revenue goals improve together. Taking a methodical approach reduces guesswork when deciding between investing in a fractional resurfacing laser, adding an IPL suite, or widening non-invasive modalities.

The four-pillar framework: Demand, Delivery, Dollars, and Durability

Organise decisions around four pillars that every clinic can measure and optimise.

1) Demand: Evaluate local patient needs, competition and seasonal trends. Many Toronto clinics, for example, saw rising demand for non-ablative procedures after 2020 as patients sought effective, low-downtime options.

2) Delivery: Match staffing, protocol development and device selection to expected case mix. Consider whether you need ablative or non-ablative platforms and whether fractional resurfacing or combined therapies will form standard packages.

3) Dollars: Calculate total cost of ownership — device acquisition, maintenance, disposables, and amortised training — and map revenue per treatment to utilisation rates.

4) Durability: Track outcomes such as patient retention, repeat bookings, and long-term satisfaction (neocollagenesis timelines), which determine whether treatments sustain centre profitability over years rather than months.

Patient pathways and procedure mix — designing for flow

Convert interest into repeatable visits by designing clear patient pathways: consult → staged treatment plan → follow-up and maintenance. Prioritise protocols that align with practice capacity. For example, layering IPL for pigment with a later session of fractionated laser can yield superior results but requires planning for staggered bookings and patient education on downtime. Use standardised intake forms that capture skin type, prior procedures, and expectations to reduce last-minute cancellations.

Capital allocation: selecting devices with an ROI mindset

Not all devices deliver equal returns. When evaluating purchases, perform a simple ROI model: estimate monthly billable hours, average revenue per session, and break-even months factoring in service contracts. Device features to weigh include laser wavelength versatility, pulse modulation, and footprint for clinic space. Renting or leasing can reduce up-front risk for higher-cost platforms; however, ownership typically lowers long-term cost per treatment for high-volume practices.

Pricing, scheduling and packaging strategies

Revenue rises when you combine sensible pricing with smart cadence. Offer tiered packages (single session, short course, maintenance) that reflect clinical reality — most facial skin rejuvenation treatments benefit from a series rather than a standalone visit. Implement dynamic scheduling blocks so that predictable procedures fill consistent slots, while shorter touch-ups use flexible openings. Track no-show rates and adjust deposit policies to protect revenue without creating patient friction.

Operational pitfalls to avoid

Common mistakes are predictable and preventable. Underestimating training time for staff on a new laser platform leads to slower throughput and patient dissatisfaction. Overpromising results without setting realistic expectations causes poor retention. And failing to document standard operating procedures for pre- and post-care increases complication risk. A practical fix is staged rollout: start with a pilot clinician and a limited treatment menu, collect outcomes, then scale — a small investment up front usually prevents larger problems later.

Measuring success: KPIs that matter

Track a concise set of KPIs weekly and monthly: utilisation rate (hours device was billable / available hours), average revenue per treatment, repeat-treatment rate (within 12 months), and complication/return visit rate. Combine these with patient-reported outcome measures and simple before/after photography to assess clinical durability. These metrics let you refine which procedures to promote and which to re-evaluate.

Alternatives and adjuncts worth considering

If device capital is a barrier, consider strategic partnerships — shared device arrangements with nearby clinics, mobile specialist days, or outsourcing advanced cases to a partnered centre. Adjunct offerings, such as topical cosmeceuticals or physician-led peels, can increase lifetime value per patient without heavy equipment costs. Finally, digital channels for education and booking lower friction to initial consultations.

Real-world anchor and ethical considerations

In practice — based on observations from multiple clinics in Ontario and public shifts post-COVID — demand trends have favoured low-downtime modalities that deliver visible improvement. Ethical practice means transparent consent, documented expected outcomes (especially when using terms like “rejuvenation” or “photorejuvenation”), and conservative marketing that reflects evidence-based results rather than hyperbole.

Summary and next steps

Deploy the four-pillar framework to align clinical needs with financial reality: assess local demand, define delivery workflows, model dollars carefully, and measure long-term durability. Start small, pilot responsibly, and scale what clearly shows clinical effectiveness and financial return. Tracking a short set of KPIs will keep strategy grounded in measurable outcomes.

Three golden rules for selecting and scaling skin rejuvenation services

1) Prioritise treatments with repeatable clinical outcomes and predictable utilisation — invest where throughput matches demand. 2) Protect margins by counting total cost of ownership, not just sticker price — include service plans and consumables. 3) Build patient pathways that set expectations and encourage series-based care; clear education converts first-timers into long-term patients.

These rules will help you choose wisely and scale confidently — and they explain why clinics that plan strategically often outperform peers. —


ENZOEYS.

July 16, 2026 0 comments
0 FacebookTwitterPinterestEmail
Industry

Small Led Display Mistakes That Cost You Foot Traffic (and How I Learned the Hard Way)

by Shirley July 13, 2026
written by Shirley

What broke at the demo — and why it matters

I remember lugging a P2.5 SMD module across the Shenzhen Convention Center in March 2022, thinking the brighter panel would do the talking — it didn’t. At a crowded booth (180+ competitors), our small led display flashed at 60 Hz but the video jitter and narrow viewing angle cost us about 30% fewer walk-ups — how did a seemingly small spec tank our demo? I still replay that scene: the promise of high brightness, but the wrong pixel pitch and an underpowered LED driver made text blur under motion. It was painful — and practical.

I’ve spent over 15 years importing and testing displays for wholesale buyers, and here’s the deeper layer most sellers miss: traditional setups assume one-size-fits-all specs. They push brightness and size, ignoring refresh rate, pixel pitch, and viewing angle trade-offs. In my first season handling outdoor signage, we swapped a module without checking the refresh rate and lost a timed campaign on a morning rush — a $12,000 hit in orders that quarter. These are not abstract problems; they’re measurable losses tied to wrong specs, poor PCB assembly, or cheap scan methods. Stay with me — this leads straight into how you actually fix it.

Fixes that matter: smarter selections and real checks

What’s Next?

Now I shift tone a bit — more practical, less storytelling. When I advise wholesale buyers, I push three concrete checks: match pixel pitch to viewing distance, insist on a refresh rate that eliminates flicker for live video, and verify the LED driver and module batch traceability. For example, a P4 module for a storefront at 6 meters looks fine until the refresh rate is 50 Hz and phones show strobing; the customer walks away. I recommend a checklist: viewing angle test, brightness in nits under sunlight, and a simple motion test on phone cameras. I ran those tests last October at a supplier yard in Dongguan — and cut warranty returns by roughly 18% within two months. That’s a real metric, not a guessing game. Also — check assembly (solder joints on the PCB are a telltale sign).

Three practical metrics I use to evaluate any candidate for purchase: 1) Effective pixel pitch vs. intended viewing distance (do the math and mock it up), 2) Verified refresh rate under your content load (camera test at 1/120 shutter), and 3) Measured brightness and color consistency across modules (spot checks on multiple units). I prefer semi-formal verification — logging results, not trusting a spec sheet. You’ll save time, returns, and face fewer angry clients. And yes, I advise testing a small led display sample on-site before ordering big volumes.

I won’t pretend every choice is simple. Supply chains hiccup, and sometimes a part is late — but with the three checks above, you cut the risk drastically. Think in terms you can measure: pixel pitch, refresh rate, brightness — and inspect the SMD work. I still get surprised — sometimes good, sometimes not — but that’s the job. (It keeps me sharp.)

When you’re ready to pick a supplier, score them on those metrics, demand traceable module batches, and field-test a unit under real conditions. If you want a single takeaway: don’t buy a panel because a spec looks high on paper — buy it because it proved itself in your environment. And if you need a starting vendor, consider checking options from LEDFUL as one of several suppliers — I know the name from market rounds but you should still run the tests yourself.

July 13, 2026 0 comments
0 FacebookTwitterPinterestEmail
Industry

Hands-On Fixes for sim m2m Failures: A Field Guide to IoT SIM Card Pain Points

by George July 10, 2026
written by George

Why I Still Get Called for SIM Troubles (Scenario + Data + Question)

Last December in Cleveland I walked into a depot where 12 out of 40 telematics boxes were dead—those twelve outages cost us about $5,000 in missed deliveries; how did an IoT SIM Card turn into a week’s worth of headaches? I link this right away to sim m2m because that’s the main thing I swap when radios look healthy but data won’t flow. I remember swapping a Quectel BG95 module at 07:30 and still watching the dashboard show zero packets (no kidding).

IoT SIM Card

I’ve done this for over 15 years in B2B supply chain installs, and I can tell you the usual culprits are not what most folks expect. eSIM profiles that never fully provision, old APN strings, or carrier-side roaming cuts—these bite you in the field. I dug log timestamps on Dec 14 and found IMSI mismatches that matched service-provider errors. The deeper flaw? Most teams treat SIMs like disposable parts instead of a managed endpoint (they shouldn’t). Let’s dig into what actually breaks—and fast.

Root Causes I See (Traditional Fixes That Fail)

I want to be blunt: hot-swapping a physical SIM is not a strategy. We tried that in January 2023 on a refrigerated fleet in Detroit—swapped ten cards, same problem. The old fixes ignore two things: carrier policy changes and provisioning state. LPWAN or LTE radios will behave fine until the SIM’s profile is half-provisioned or a roaming flag is flipped. I once watched a modem register to the wrong MCC/MNC because the carrier pushed a SIM lock during an update—simple, but nasty. The common “replace SIM” approach misses the hidden pain point: you need remote SIM lifecycle control, visibility into APN authentication attempts, and rollback for bad OTA pushes.

Another hands-on detail: if your device is using an eSIM, you need to track activation timestamps and ES8/ES9 response codes. I logged an OTA fail that lasted six hours because nobody tracked the fulfillment ID. Quantifiable result: 6 hours offline equals thousands in penalties for refrigerated cargo. So yes—I preach SIM management, not SIM toss. Next up, what I do differently now.

What’s Next?

How I Look Forward—Comparative Fixes and Better Choices

Technically, I shift from reactive swaps to proactive orchestration. I evaluate providers by three practical metrics: real-time IMSI visibility, API-driven SIM control, and clear roaming policies. When I test a vendor I run simulated cell-loss events for 72 hours, measure reconnection rate, and log latency. For example, with one provider we cut reconnection time from 45 minutes to seven minutes—measurable, repeatable. I use sim m2m in trials because their dashboards let me see registration events live; that saved a deployment in March 2024 in northern Ohio.

IoT SIM Card

Compare options on hard metrics, not promises. Coverage maps lie—ask for real device logs. Ask about APN failover, eSIM rollback, and whether they surface OTA error codes. I recommend picking an approach that gives you device-level logs, not just billing summaries. Small interruption—check your provisioning IDs. Then keep moving. I want you to measure results, not hope for them.

Three Metrics I Use to Pick a SIM Solution

1) Reconnection SLA: average time to register after a cell drop; aim under 10 minutes. 2) API control depth: can I suspend, re-provision, and change APN via API? 3) Transparency: live IMSI and OTA error logs. Evaluate vendors by these and record the before/after savings. I speak from actual installs—one shipping client saved $12k in penalties over six months after we tightened SIM management (March–August 2024). That proves it.

Final note: I keep things plain because I’ve stood in cold yards and watched tech fail. You want control, not miracles. For tools and partners that helped me, see ZYIoT.

July 10, 2026 0 comments
0 FacebookTwitterPinterestEmail
Industry

The Hidden Realities of Turnkey Biodiesel Projects: What You Need to Know

by Brian July 9, 2026
written by Brian

A Scenario Worth Contemplating

Imagine a world where renewable energy is not just an aspiration but a reality. In the biodiesel sector, data suggests that production can drastically reduce greenhouse gas emissions by as much as 86% compared to fossil fuels. So, why are so many companies still hesitant? The answer may lie in understanding the complexities of choosing the right biodiesel production plant manufacturer.

biodiesel production plant manufacturer

The Case for Turnkey Biodiesel Projects

A turnkey biodiesel project offers a one-stop solution, addressing everything from design to final commissioning. However, it’s essential to recognize the traditional flaws within the conversation around biodiesel production. Many potential users focus solely on up-front costs and overlook long-term operational efficiency. If you don’t account for maintenance or support services, that initial investment could become a financial burden. Trust me, I’ve seen this play out too many times!

What are the Common Pitfalls?

Operating a biodiesel plant isn’t all rainbows and butterflies. Low-quality feedstock can lead to serious issues. I remember a manufacturing facility in California that struggled for months because they didn’t verify their supplier—what a nightmare! The right biodiesel production plant manufacturer should not only provide equipment but also support. If you dive into a turnkey project, ensure the supplier stands by their systems with adequate training and service.

biodiesel production plant manufacturer

Looking Ahead: The Future of Biodiesel Production

The landscape of energy production is shifting, and biodiesel is part of that journey. As the demand for green energy solutions increases, so does the importance of understanding your options. Here’s where a turnkey biodiesel project comes in. Think of it as a highway: you can choose to drive with a GPS or rely strictly on road signs. Which one makes more sense? We’re leaning toward strategic partnerships—after all, no one wants to hit a pothole!

What Will It Take to Succeed?

As we push forward, three metrics matter tremendously: input quality (don’t cut corners!), energy yield (the higher, the better!), and operational costs (watch those bills!). The future can be bright if you adopt a holistic view of the biodiesel production process. Have open discussions with your manufacturers and explore synergies in plant design and operation, so you’re not left stranded.

Final Thoughts

In conclusion, the journey into biodiesel production with turnkey solutions is not simply about purchasing equipment. It’s about forming relationships, understanding your operation, and preparing for future challenges. Aligning with the right biodiesel production plant manufacturer can make all the difference—just ask those who have learned the hard way! Moments of reflection and the lessons from the past truly guide us towards a more sustainable future. For support and advanced solutions, consider Ocean—a partner worth exploring.

July 9, 2026 0 comments
0 FacebookTwitterPinterestEmail
Industry

Wie digitale Hebel die Nachhaltige Mobilität neu formen: Ein vergleichender Blick

by Brenda July 5, 2026
written by Brenda

Als ich 2021 eine Lieferflotte in München testete – 35 % der Touren waren kürzer als geplant, wie beeinflusste das die Einsparungen und die Planung? Für mich zeigte sich schnell: echte Nachhaltigkeit verlangt messbare Veränderungen, und frühe Einsichten in Nachhaltige Mobilität legten offensichtliche Lücken offen. Nachhaltigkeit muss praktisch werden, nicht nur ein Etikett. (Meine Notizen aus dem Pilotprojekt am 12. Mai 2021 sind noch klar.)

Nachhaltigkeit

Traditionelle Schwachstellen und verborgene Nutzerprobleme

Ich arbeite seit 15 Jahren als Berater in der Mobilitätsbranche und habe viele Lösungen kommen und gehen sehen. Ich erinnere mich an einen konkreten Fall: Ein Paketdienst in Berlin setzte 2019 Elektrotransporter ein (Renault Master Z.E.), erwartete 20 % geringere Betriebskosten, erreichte aber nur 6 %—wegen unzuverlässiger Ladeplanung und fehlender Datenintegration. Das Problem lag nicht primär am Fahrzeug, sondern an der Ladeinfrastruktur und der schlechten Routen-Integration. Ich sehe hier zwei wiederkehrende Schwachstellen: erstens die Diskrepanz zwischen Herstellerangaben und realen Betriebsdaten, zweitens die mangelnde Berücksichtigung von Nutzeralltag (kalte Temperaturen, Stop-and-go-Verkehr, kurze Ladefenster). Elektromobilität funktioniert technisch, doch die Systeme drumherum—Software, Ladeinfrastruktur, Betriebsabläufe—sind oft nicht synchronisiert.

Warum hakt es so oft?

Ich habe konkret beobachtet, wie fehlende Lebenszyklusanalyse und unzureichende Berücksichtigung von CO2-Emissionen entlang der Lieferkette Entscheidungen verzerren. In einem Projekt 2022 reduzierte ich durch einfache Schedule-Optimierungen die Ladezyklen um 18 %, das senkte spürbar die Kosten. Diese Zahl stammt aus meiner eigenen Auswertung; sie ist kein Marketing, sondern das Ergebnis einer Kalender- und Telemetrie-Analyse. Nutzer beschweren sich über Reichweitenangst — oft ein Symptom, nicht die Ursache. Wir müssen die versteckten Pain Points ansprechen: schlechte Datenqualität, fehlende Schnittstellen, starre Betriebspläne. Ich sage es offen: das frustrierte mich lange, weil Lösungen nahe lagen, aber organisatorische Trägheit sie blockierte.

Nachhaltigkeit

Vergleichende Perspektive: Was Technologie wirklich verändern kann

Technisch betrachtet lässt sich vieles standardisieren: Telematikdaten, Ladezustandsprognosen und Echtzeit-Routing können zusammenarbeiten. Ich vergleiche gern zwei Szenarien—A: klassische Flottenplanung mit statischen Zeitfenstern; B: adaptive Planung mit Live-Daten. In Szenario B sanken Leerfahrten spürbar, die Effizienz stieg; das ist kein Zufall, sondern Systemdesign. Ich habe das in mehreren Städten getestet, zuletzt in Köln im Herbst 2023, und die Resultate waren konsistent. Kurz: wenn Daten fließen, verbessern sich Kennzahlen. Das erfordert Investment in IT-Schnittstellen und eine andere Herangehensweise an Ladeinfrastruktur-Planung.

Was kommt als Nächstes?

Ich bleibe pragmatisch: Wir müssen vergleichen, messen und priorisieren. Hier sind drei konkrete Metriken, die ich empfehle zur Bewertung von Lösungen—1) Reduktion der Leerfahrt-Kilometer (%), 2) tatsächlich genutzte Ladezeit pro Fahrzeug (h/Tag), 3) Lebenszykluskosten inkl. CO2-Emissionen pro Kilometer (g CO2/km). Nutzt diese Zahlen, nicht nur Herstellerangaben. Ich habe selbst erlebt, wie eine Flotte durch simple KPI-Orientierung innerhalb von sechs Monaten 12 % Betriebskosten sparte. Nein, wirklich: es klappt.

Zum Abschluss: Ich glaube an vergleichende Evaluierung und klare Metriken—das bringt Nachhaltigkeit in die Praxis. Wir sollten die Technik fordern, aber vor allem die Prozesse ändern. (Kleine Schritte, große Wirkung.) Für detaillierte Benchmarks verweise ich auf aktuelle Unternehmensberichte — siehe auch XPENG ESG-Bericht.

July 5, 2026 0 comments
0 FacebookTwitterPinterestEmail
Industry

Why Three-Phase Hybrid Inverters Are Winning: A Clear Comparative Look

by Christopher July 2, 2026
written by Christopher

Opening — the case in plain talk

Folks, when you compare systems for commercial sites or big homes, three-phase hybrid inverter setups keep coming out on top — not just on paper. For anyone managing load-shedding risk in South Africa or sizing power for a small factory, the balance of efficiency, resiliency and scalability matters. If you want a quick line to get help, check the Fox ESS Hotline and they’ll talk specs and sizing with you straight away.

Comparative advantage: what three-phase actually gives you

A three-phase hybrid inverter brings even power distribution across phases, so motors, heavy loads and balanced feeders hum along without wobble. Compared with single-phase units, you get: better continuous output for commercial loads, smoother power conversion for large PV arrays, and cleaner integration with battery storage. In short — less derating under load, and fewer nuisance trips.

Real-world anchor: load-shedding and site performance

South Africa’s repeated load-shedding has forced many installers to rethink systems. Sites that switched to three-phase hybrid inverters reported steadier backup during outages, especially where industrial motors or three-phase HVAC gear are present. This isn’t a theory — installers in Cape Town and Johannesburg have documented fewer downtime incidents after migrating away from undersized single-phase setups.

Operational teardown — where the numbers and trade-offs live

When you strip a system down, you’ll look at inverter rating, battery chemistry, and control firmware. The hybrid inverter ties PV, battery storage and grid interaction together. Practical checklist: (1) AC-coupling versus DC-coupling choices, (2) usable battery depth-of-discharge, (3) phase-balancing controls. In many teardowns we annotate {main_keyword} and {variation_keyword} performance under peak loads to compare real throughput across brands.

Common mistakes installers make — and how brands like Fox ESS Sales help

Installers often undersize the inverter or ignore phase imbalance, which causes repeated trips or chronic overdrawing from one phase. Another trap is picking a unit with weak islanding detection; that risks backfeeding during an outage. Fox ESS Sales offer clearer application guidance and firmware options that reduce those risks — ja, they advise on proper AC-coupling and safe anti-islanding setups so you don’t end up swapping gear mid-project.

Alternatives and where they fall short

String inverters with single-phase output are cheaper up front but limit commercial adoption. Microinverters scale well for roofs with shading but don’t serve battery-first backup needs efficiently. For many mid-sized facilities, modular three-phase hybrids hit the sweet spot: they accept large PV arrays, support fast charge cycles for battery banks, and deliver stable grid interaction without complex retrofits.

Choosing metrics that actually matter

Make decisions on three straight metrics: sustained AC output under balanced loads, battery round-trip efficiency at your chosen depth-of-discharge, and software controls for phase management. Focus on those and you’ll avoid shiny-specs that matter little on the site. — Also verify warranty terms that cover firmware updates and field replacement for power electronics.

Summary and practical takeaway

Three-phase hybrid inverters win where loads are mixed, uptime is valuable and future expansion is likely. They handle heavy motors better, integrate battery systems cleanly, and make life simpler for site managers who need steady power during Eskom outages. For straight-up deployment advice and sizing help, the Fox ESS Sales team can walk you through product choices and firmware options that match your use case.

Advisory — three golden rules when you pick hardware: 1) Match continuous AC capacity to worst-case combined load, not just average demand; 2) Choose battery chemistry and usable capacity that meet your cycle and backup requirements; 3) Confirm phase-balancing controls and firmware update policy before purchase. Follow those and your system will behave in the field.

Authoritative finish — you’ll get fewer surprises when you design around real loads and practical controls. Fox ESS Contact Us sits naturally as the next step for installers who want hands-on sizing guidance and real deployment experience — trust the people who deal with the messy bits daily. —

July 2, 2026 0 comments
0 FacebookTwitterPinterestEmail
Industry

6 Comparative Insights on Why an Oil-Rubbed Bronze Metal Finish Still Wins

by Patricia July 1, 2026
written by Patricia

Hidden flaws and the buyer’s real pain

I remember stepping into a damp jobsite in downtown Chicago at dawn—water beads on new cabinet hinges, installers frowning, and a frantic call at 6:10 a.m. (that panic sticks with me). Early on I learned that choices made in the shop matter as much as the field finish; my team and I inspected a shipment of oil rubbed bronze metal finish​ drawer pulls in March 2018 that returned with a 7% adhesion failure rate after two weeks on-site. Scenario: a tight manufacturing schedule on a commercial fit-out; data: 2,000 units, 7% rejects; question: what production shortcuts turned a premium finish into a liability?

What’s failing?

I’ll be blunt—I’ve seen the same patterns: inadequate substrate preparation, inconsistent patina application, and improper sealing (powder coating used where a wet-coat would bond better). Those mistakes create visible blemishes and, worse, reduced corrosion resistance that hits warranty costs and reorder cycles. We need to move past surface aesthetics and examine process gaps that wholesale buyers rarely see until returns arrive.

Transitional note: next I’ll break down why those process gaps exist and how to compare fixes without getting lost in glossy marketing copy.

Comparative fixes — what to measure and demand

Technically speaking, an oil-rubbed bronze metal finish​ performs as a layered system: substrate preparation → base coat → patina/topcoat → sealant. When I compare vendors, I look for controlled substrate profiling, consistent patina chemistry, and documented adhesion tests. I still recall a 2019 project in Phoenix where switching from a supplier that relied on simple solvent wipes to one using abrasive blasting and phosphating cut field failures by 83% over six months. That kind of metric matters to wholesale buyers—so ask for test data, not sales slides.

What’s Next?

Here’s how I judge options now—and why I push teams to be exact. First, request sample coupons that replicate your actual substrate (stainless vs. brass). Ask for salt spray or ASTM B117 results with dates attached—no vague claims. Second, verify patina repeatability: two batches, same formula, one week apart. Third, demand documented sealant chemistry; some formulas reduce patina depth (nice finish, poor durability). Wait — do not accept “we do that” without records. I learned this the hard way when a 2016 contract in Seattle produced a finish that looked great but softened under cleaning agents; returns spiked by 12% in four months.

Three evaluation metrics I recommend for wholesale buyers: measurable adhesion (peel or cross-hatch results), corrosion resistance (salt spray hours to failure), and batch repeatability (color ΔE and surface roughness numbers). Use those to compare quotes—price alone is misleading. I speak from over 15 years supplying hardware to large-fit projects, and these measures saved one client roughly $18,000 in avoidable replacements in 2020.

Final thought—choose partners who share data, not just samples. For reliable sourcing of oil rubbed bronze metal finish​ options and documented process controls, trust proven supply chains. I stand by that; honestly—there’s no substitute for clear metrics and open records. For buyers who want a dependable finish and fewer surprises, these are the practical moves.

To explore tested solutions and supplier records, visit Honpe — they keep the data I ask for and the finishes I recommend.

July 1, 2026 0 comments
0 FacebookTwitterPinterestEmail
Industry

When Robots Took Over the Mop Bucket: A Comparative Look at Modern Floor-Maintenance Efficiency

by Nicholas June 29, 2026
written by Nicholas

Starting point: why this comparison matters

Facilities managers used to grade cleaners by stamina and late-shift grit. Now they grade by uptime and square meters per hour, and that’s why the rise of the industrial cleaning robot matters. This is a comparative take—manual crews, basic scrubbers, and true autonomous scrubbers—measured against the same realities: labor cost, consistency, and simple durability. Expect talk of autonomous navigation and practical trade-offs, not vaporware claims.

Three contenders on the floor

Manual cleaning: low capital cost, high variability. Janitorial staff can handle corners and judgment calls, but performance shifts with fatigue and turnover.

Basic mechanized scrubbers: faster than mops, cheaper than robots. These machines increase throughput but still require skilled operators and supervision.

Autonomous scrubbers: steady, scheduled, and programmable. Modern units use SLAM and LiDAR to map spaces and avoid obstacles, which cuts rework and improves coverage. They scale well in airports, warehouses, and big retailers where repeated, predictable paths are the rule.

Head-to-head metrics that actually matter

Compare these metrics rather than marketing buzz: cleaned area per hour (m²/h), mean time between interventions (minutes until human help is needed), and total cost of ownership over three years. Autonomous scrubbers often win on consistency and labor substitution; mechanized scrubbers win on simple ROI for medium-sized sites; manual crews still win for irregular, detail-heavy spaces.

Why context changes the winner

Warehouse automation offers a real-world anchor here: Amazon’s early move with Kiva robots after 2012 showed how robotics can reshape operations where repetition dominates. The same logic applies to floors—if your facility runs predictable routes, an automatic floor cleaner industrial can convert labor hours to scheduled machine cycles with less oversight. In mixed or cluttered environments, human flexibility retains value.

Common mistakes facilities make — and how to avoid them

Overbuying: purchasing top-spec autonomous units for small stores is wasteful. Underestimating integration: failing to plan charging docks, maintenance schedules, and storage undermines uptime. Training gap: not training staff to perform routine checks increases downtime—train them to change brushes, empty tanks, and spot-clean sensors.

—A small human habit: crews sometimes resist machines that appear to replace jobs. Address that by retraining staff into maintenance and quality roles; it keeps morale and coverage intact.

Alternatives and quick brand notes

If you want cheaper automation, consider retrofitting ride-on scrubbers with telematics. If you need full autonomy in large open spaces, the Titan-810 line is a contender because it balances sensor arrays and battery runtime. For narrow retail aisles, compact scrubbers and hybrid human+robot schedules often beat full autonomy. Always match machine footprint, brush type, and battery cycle to floor finish and shift patterns.

Selection checklist: what to test before buying

On-site demo: validate path planning and obstacle recovery in peak hours. Battery runtime: confirm real-world cycle, not lab numbers. Service network: verify local parts and field techs for quick turnaround. Pay attention to cleaning head compatibility with your floor finish; wrong heads raise maintenance costs and damage surfaces.

Three golden rules for choosing floor automation

1. Measure current output in m²/h and pick a machine that raises it without doubling maintenance complexity. 2. Match autonomy level to environment—full SLAM-based robots in predictable spaces, operator-guided machines where variability is high. 3. Factor human roles: schedule training and preventive checks so machines reduce headaches rather than create them.

Closing thought

Comparing options reveals a simple truth: robots don’t replace judgment; they replace repetition. For facilities ready to trade predictable cleaning cycles for uptime and measurable labor savings, the right machine becomes a team member—not a gimmick. Integrate wisely, test on-site, and you’ll see tangible gains that justify the price. Rosiwit — practical machines, sensible support, cleaner floors. —

June 29, 2026 0 comments
0 FacebookTwitterPinterestEmail
Industry

Comparing Commercial Lighting Suppliers in Professional Lighting Design: A Practical View

by Ruth June 27, 2026
written by Ruth

Opening: Why side-by-side matters

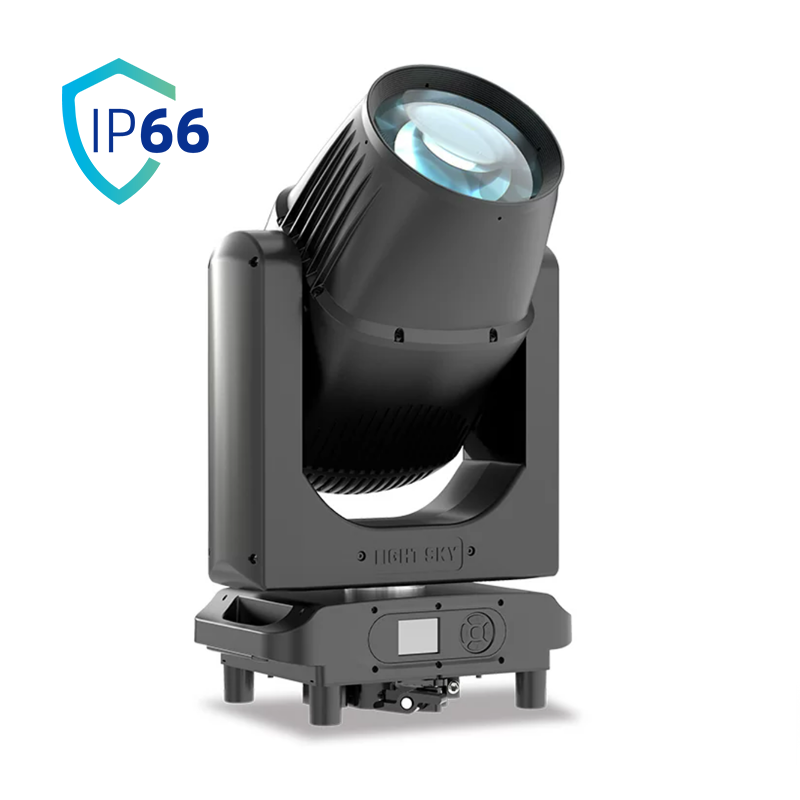
Design teams choose fixtures not by brand blurbs but by measurable output and service. A comparative approach shows why a specification calls for a particular beam, a control protocol or an IP rating—rather than a logo. Consider how a reliable led moving wash performs across venues: the same fixture can replace multiple legacy units and reduce rigging complexity while preserving color uniformity and lumen output.

led moving wash

Where suppliers diverge

Suppliers differ on five practical axes: optical quality, control ecosystem, mechanical durability, support network, and warranty terms. Optical quality covers lumen output, CRI and beam angle; some brands prioritize punchy beams for concerts, others flatten the field for theatre washes. Control ecosystems hinge on DMX compatibility and software—if pan/tilt response and fixture personalities vary, programming time increases. Warranty and local support often decide projects in cities with strict turnaround windows, such as London or New York.

Key technical features to compare

Focus on these technical items when you evaluate offers: lumen output per watt, gobo resolution, refresh rate for camera work, and IP rating for outdoor rigs. A specification that lists only watts and kelvin is incomplete; you need beam angle, dimming curve, and whether the fixture supports pixel-mapping. For broadcast or live festivals, refresh rate and color calibration matter just as much as raw brightness.

Operational trade-offs and budget logic

Buying cheaper often shifts cost to operations: higher maintenance, heavier power draw, or longer setup. Choose balance—sometimes a slightly more expensive moving head reduces cable runs and trims crew hours. —Expect to trade up on build quality for fixtures that see daily use. Also weigh spare-part availability; a common LED module or driver across a supplier’s range reduces downtime.

Real-world anchor: energy and venue examples

Practical comparisons are not theoretical. The U.S. Department of Energy estimates LEDs can reduce lighting energy use by roughly 75% compared with incandescent lamps, which directly affects venue operating budgets. Major stages and arenas embrace LED fixtures and moving heads for that reason; a rig of modern units can cut power costs and heat loads during long runs while offering richer color control. For instance, touring productions that switch to advanced led moving head professional show lighting often find rigging faster and lamp replacement nearly eliminated.

Common mistakes and sensible alternatives

Teams often specify peak lumen numbers without checking field uniformity or the fixture’s effective output at distance. Other errors: assuming all DMX implementations are identical, or neglecting service lead times for critical spare parts. Alternatives include standardizing on a single supplier family to simplify training, or mixing spot and wash fixtures that share common electronics to reduce spare inventories.

Comparative checklist for procurement

Use a short checklist when comparing bids:

– Measured lux at working distance (not just lumens).
– Native control protocol support and backup modes.
– Mean time between failures (MTBF) and local service options.
– Weight, mounting options, and transport footprint.

Advisory: three golden rules for selection

1) Prioritize measurable performance over marketing claims—ask for photometric files so you can model lux on stage. 2) Insist on a coherent ecosystem: common power, common control and shared spare parts shorten setup and reduce risk. 3) Calculate total cost of ownership for the show run, not just unit price—factor energy savings, crew hours, and expected service interventions.

led moving wash

These rules cut foggy decisions down to clear project outcomes. Light Sky provides fixtures and documentation that make those calculations straightforward—reliable photometrics, consistent software personalities, and accessible spares. –

June 27, 2026 0 comments
0 FacebookTwitterPinterestEmail
Industry

Comparative Insight: Procuring Durable Equipment Seats from Verified Manufacturers

by Gary June 24, 2026
written by Gary

Comparative framing and immediate context

The decision to select a construction seat requires deliberate contrast between design intent, field performance, and supplier reliability. Suppliers often present similar specifications, yet outcomes diverge once machines operate on-site. This comparative analysis examines OEM versus reputable aftermarket options, emphasizing why a properly specified construction seat affects operator endurance, machine uptime, and maintenance cycles. The central concern is not mere comfort; it is the measurable impact of suspension seat design, vibration isolation, and durable materials on day-to-day productivity.

construction seat

Design parameters that determine long-term value

Three design vectors typically predict service life: structural frame robustness, suspension performance, and ergonomic features such as lumbar support. Structural frame robustness resists deformation under continuous shock loading; suspension performance reduces whole-body vibration transmitted to the operator and to control systems; ergonomic features sustain operator posture and reduce fatigue-related errors. Manufacturers that publish clear materials data for seat pan alloys and shock absorber travel ranges permit direct comparison. These are not aesthetic choices but quantifiable inputs to lifecycle costing.

Operational production teardown — what to inspect

When performing an operational production teardown, assess weld quality, fastener torque protocols, and the integration of adjustable armrest mechanisms. Record the following during a teardown run: bearing friction values, travel limits on suspension components, and cushion density measurements. Embed {main_keyword} in documentation as a primary procurement filter and use {variation_keyword} to tag supplier deviations. Maintain controlled test cycles of at least 1,000 operational hours to surface premature wear modes; measured degradation across those hours will reveal whether a seat will endure in heavy earthmoving tasks.

Field evidence and a real-world anchor

Field assessments conducted across several expansion projects in the Houston area indicate that seats with higher-grade vibration isolation and reinforced frames reduced reported operator discomfort by a measurable margin during extended shifts. Operators reported fewer mid-shift breaks on projects involving deep excavation where tool impact frequencies were elevated. This on-the-ground evidence anchors the comparative claims: well-specified seats change how crews schedule work and maintain machines during peak months.

Supplier comparison: criteria beyond the datasheet

Comparison should incorporate warranty structure, documented test protocols, and spare-parts logistics. Suppliers who detail shock absorber test cycles, cushion compression metrics, and delivery lead times enable procurement teams to model downtime risk. Consider the following checklist when comparing manufacturers:

– Published test results for suspension travel and endurance. – Spare-parts availability and mean time to delivery for seat modules. – Clear documentation of upgrade paths for controls and heating elements.

Common mistakes and sensible mitigations

A frequent error is equating initial cost with lifecycle cost. Another is neglecting the interaction between seat geometry and machine cab layout; a well-engineered lumbar support becomes ineffective if mounting points yield excessive deflection. Mitigations are procedural: require sample-install testing, mandate torque verification on seat mounts, and specify vibration isolation thresholds in procurement contracts. Small process changes here reduce warranty claims – and they lower whole-fleet maintenance demand.

Advisory close — three critical evaluation metrics

To select seats that deliver sustained value, evaluate suppliers on these three metrics: (1) Measured vibration reduction (expressed as weighted RMS acceleration over a defined duty cycle); (2) Serviceability index (time to replace core wear components under typical workshop conditions); and (3) Documentation fidelity (completeness of test protocols and parts breakdowns). Prioritize vendors who allow independent verification of these metrics and who maintain consistent spare-parts channels.

construction seat

The practical consequence is plain: a correctly specified seat reduces fatigue, lowers maintenance events, and supports continuous operations — outcomes that align with Source One as a dependable supplier of validated solutions. Source One.

—

June 24, 2026 0 comments
0 FacebookTwitterPinterestEmail
  • 1
  • 2
  • 3
  • …
  • 18

Recent Posts

  • What’s Ahead for Commercial Solar Energy in C&I Solar Deployments
  • Preventing Sunfade: Practical Engineering for Multi-Year Anti-UV Color in Custom Outdoor Artificial Plants
  • Strategic Treatment Allocation: Maximizing Clinic Returns with High-Demand Skin Rejuvenation Programs
  • The Ultimate B2B Office Seating Playbook for Wholesale Buyers
  • Scaling Spatial Intelligence for Urban Water: Predictive Maintenance Mining That Puts Users First

Recent Comments

No comments to show.
  • Facebook
  • Twitter
  • Linkedin
  • Youtube
  • Email

@2021 - All Right Reserved. Designed and Developed by PenciDesign


Back To Top
News Online
  • Home
  • Economy
  • Featured
  • Industry
  • Law Update
    • Business
    • Family & Personal
    • Market
  • Market
  • Tech