News Online
  • Home
  • Economy
  • Featured
  • Industry
  • Law Update
    • Business
    • Family & Personal
    • Market
  • Market
  • Tech
Category:

Market

Market

What’s Ahead for Commercial Solar Energy in C&I Solar Deployments

by Nancy July 17, 2026
written by Nancy

Facing the Root Causes: Why Traditional Systems Fail

Last August I climbed onto a loading-dock roof over a tired 500 kW PV array, watched the SCADA feed report a 27% drop during peak sun—what fixes are we still missing? commercial solar energy is the backbone for many facilities, and C&I Solar teams I advise keep running into the same invisible losses. I’ve been in B2B supply-chain procurement for over 15 years, and I can tell you the numbers that matter: inverter mismatch, soiling losses, and poor energy storage dispatch strategies quietly shave margins every month (yes, monthly).

C&I Solar

I vividly recall a June 2019 retrofit at a Houston distribution center where a faulty string inverter and a mismatched DC-coupling layout cost the operator roughly $12,000 in lost production during the first quarter after install. That concrete example taught me we’re not losing energy to superhero-level mysteries; we’re losing it to assumptions—wrong spec sheets, lax commissioning, and billing systems that ignore demand-charge spikes. When I speak with plant managers they don’t talk about ROI in abstract; they talk about specific pain—meter spikes at 3 p.m., failing communications, and energy storage systems that sit idle. These are operational failures, not theory. Read on for hard fixes that actually move the needle.

Practical, Forward-Looking Fixes for Better Returns

Let me define the core pivot I preach: use measured dispatch logic, not vendor promises. Start with accurate baseline metering, then size the inverter and energy storage to the load profile—don’t guess. When I helped spec a 750 kW grid-tie plant in Phoenix in March 2021, we cut demand charges by 27% simply by retuning charge/discharge thresholds and prioritizing peak shaving. That’s the kind of measurable win procurement teams can quantify and replicate.

C&I Solar

What’s Next: Tech and Procurement Alignment?

Here’s the plan I push in client workshops. First, treat PV, inverter, and storage as an integrated product bundle—spec them together. Second, require a 90-day performance guarantee tied to real site conditions (temperature, soiling rates). Third, insist on open telemetry and firmware rollback rights—no black-box surprises. I’ve written the contract clauses; I’ve enforced them in contract negotiations. Small clause. Big impact. Also—be pragmatic about warranties. A five-year inverter warranty with a 98% uptime SLA trumps glowing manufacturer slides.

Three Metrics to Choose the Right System

I’ll close with the three evaluation metrics I force on every RFP. 1) Measured kWh lost to soiling and mismatch over the first 12 months—if a vendor can’t supply baseline estimates, they’re guessing. 2) Demand-charge reduction percentage projected and guaranteed for peak months (June–September). 3) Round-trip efficiency and usable energy of the energy storage system under site-specific temperature ranges. These three metrics separate sales pitches from real solutions. They also give you leverage in pricing and service terms.

I know this sounds blunt. That’s intentional. I want teams to act with clarity—no vague promises, no optimistic models without field data. Yes—sometimes that means pushing back on a vendor. It’s worth it. For practical support and tighter specs, check the resources at sungrow.
July 17, 2026 0 comments
0 FacebookTwitterPinterestEmail
Market

Fixing Rain-Blur: How Aperture Shapes Low-Light 4G Dash Cam Performance

by Brenda July 12, 2026
written by Brenda

The problem on wet roads

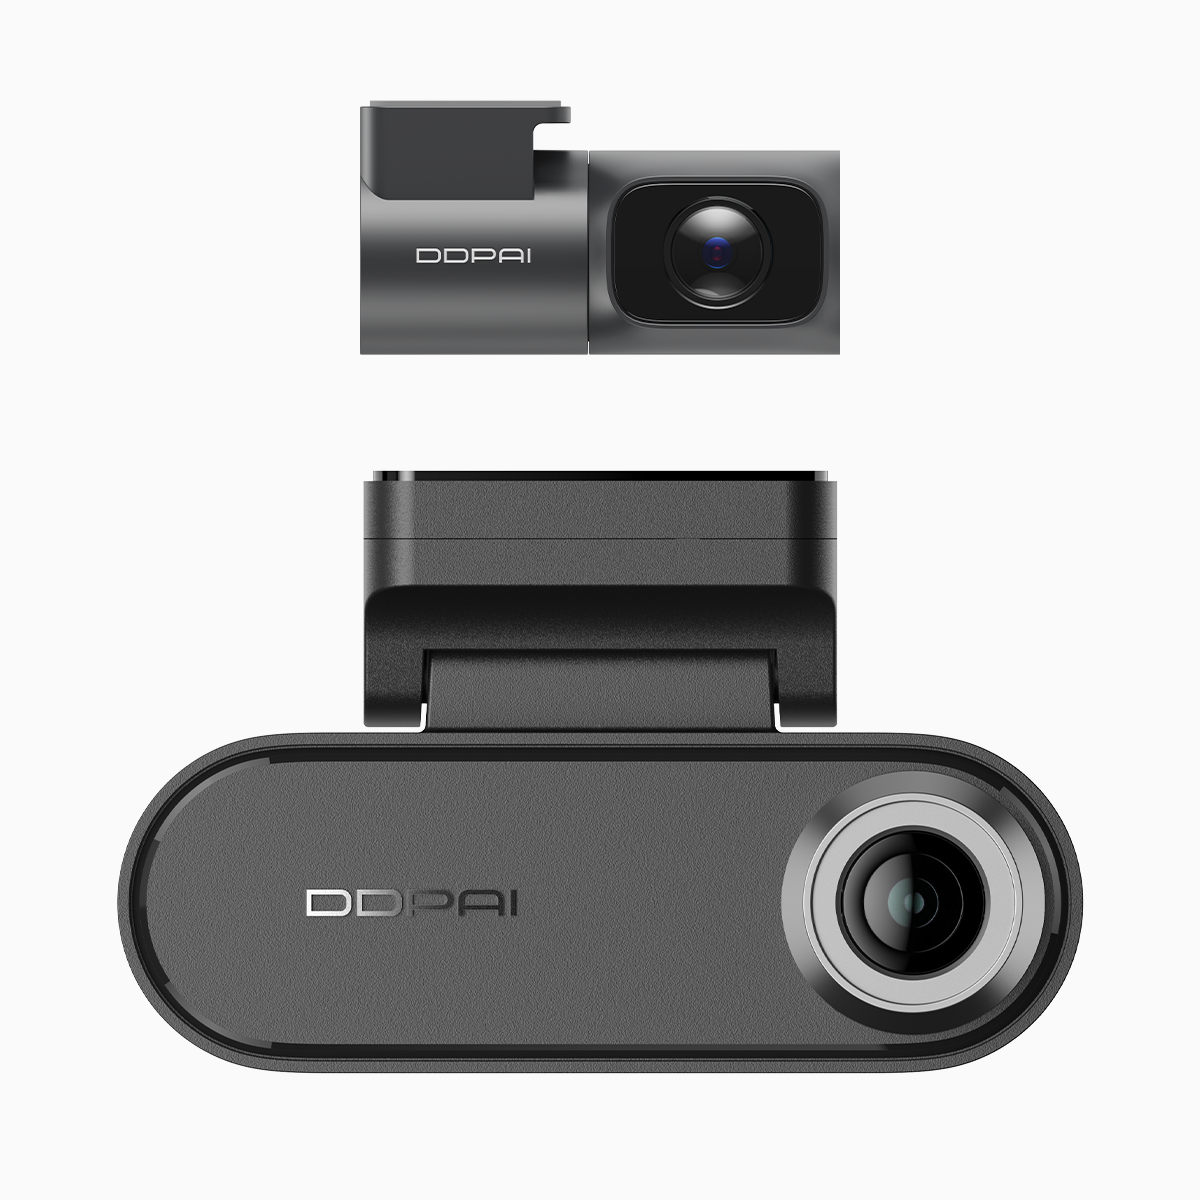
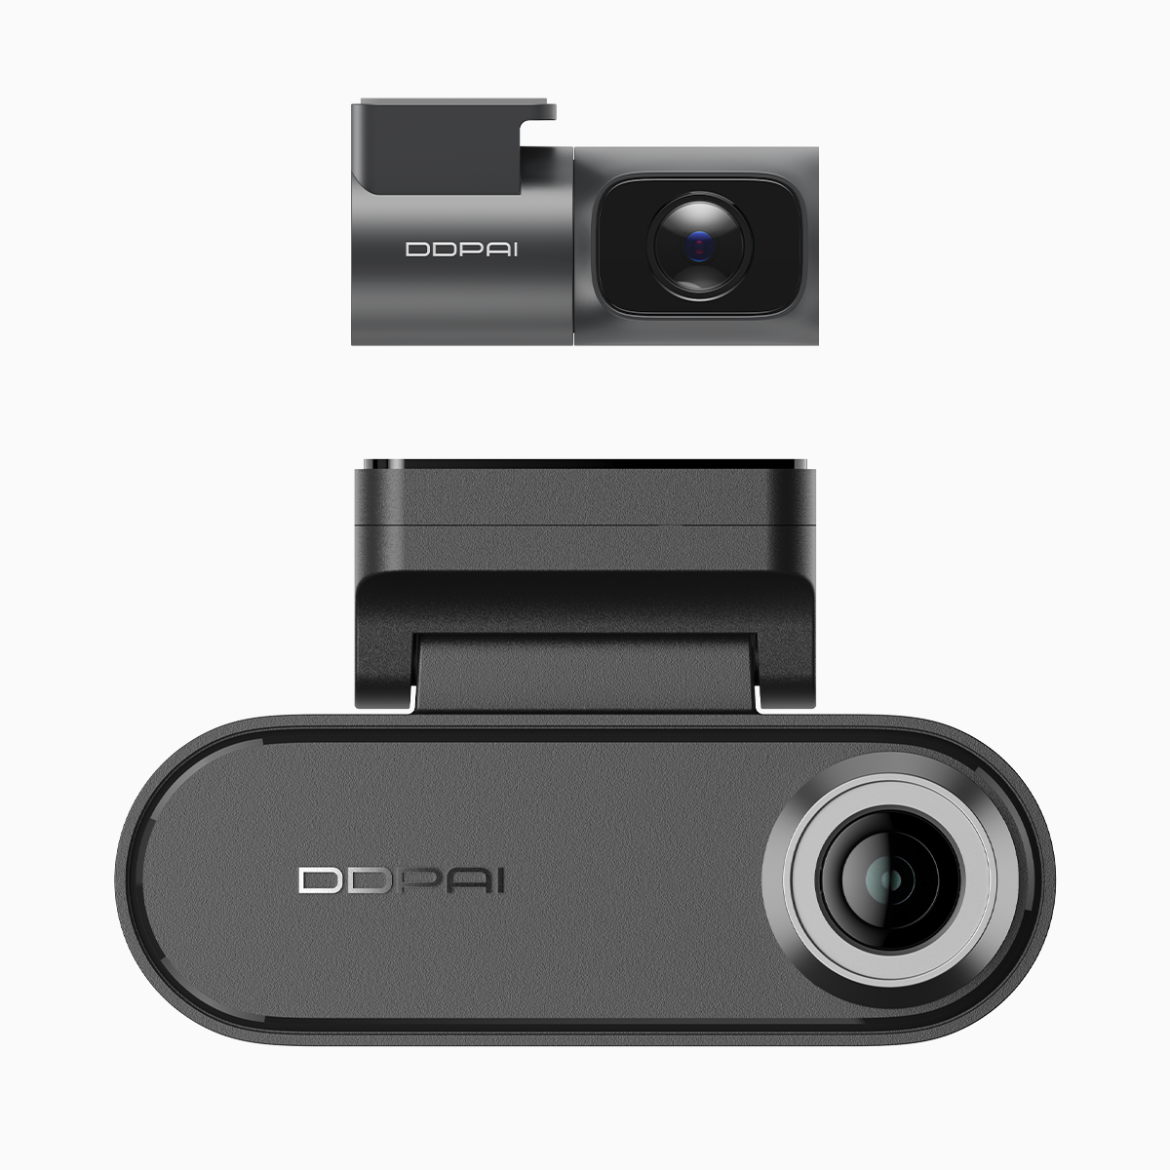
Heavy downpours during monsoon months cut visible detail and scatter light across the windshield, and that collapse in contrast is exactly where many dash cams fail. A well-chosen aperture changes how much light the sensor actually receives, which matters far more than raw megapixels when you’re recording during a storm. Practical units like the dual dash cam with parking mode combine optics and firmware choices to cope with these scenes, but understanding the core issue helps you pick the right model for Metro Manila-style monsoon driving and similar environments.

dual dash cam with parking mode

Why aperture is the core hardware decision

Aperture controls light entering the lens: a lower f-number means a wider aperture and more photons hitting the sensor per frame. That boosts low-light sensitivity and lets the camera use faster shutter speeds for reduced motion blur. But it’s not a magic fix—wider apertures reduce depth of field and can accentuate raindrop blur on the windshield, so optics and sensor design must be balanced. Industry words to note here are aperture, sensor size, and exposure—they’re the key levers that determine usable footage in downpours.

How sensor sensitivity and processing work together

Sensor sensitivity (often expressed through ISO behavior) and the image signal processor (ISP) determine usable detail when photons are scarce. Higher ISO increases brightness but also noise; modern ISPs apply noise reduction and local contrast boosts to recover detail. Dynamic range matters too: cameras with wider dynamic range retain highlights from street lights while preserving shadow detail under overcast skies. Firmware that manages exposure and white balance in wet conditions often matters more than one extra megapixel.

dual dash cam with parking mode

Practical setup and common mistakes

Mounting, windshield condition, and exposure settings are where people lose good footage. Position the camera close to the rear-view mirror to lessen windshield distortion, and keep the glass free of film and water beads with an alternating wiper or hydrophobic treatment. Avoid forcing a tiny sensor to compensate with extremely high ISO — the result is grainy, unreadable video. Models with an intelligent parking mode help too; look for a dash cam with parking mode that buffers footage and wakes on impact. If you tune exposure bias down slightly you often get crisper highlights from reflections — small tweaks yield big improvements. — Don’t overlook firmware updates; they can change exposure behavior significantly.

Common alternatives and why they differ

Low-cost cameras often use small sensors and narrow apertures, relying on software amplification. Premium units invest in larger sensors, faster glass, and multi-exposure HDR processing. The trade-offs are straightforward: physics (aperture and sensor) gives you raw capture ability; software (ISP, noise reduction) extracts the best image from that capture. If you need evidence-quality footage during severe rain, prioritize optics and sensor over extra features like UI bells and whistles.

Three golden rules for buying and tuning

1) Aperture priority: Aim for a dash cam with a wide aperture in the f/1.6–f/2.2 range to improve photon capture without extreme depth-of-field issues. 2) Sensor and processing: Prefer larger sensors and models that advertise low-light performance or HDR; those yield clearer frames at moderate ISO. 3) Parking-mode reliability: Ensure buffered parking mode, impact wake-up, and reliable power management; these functions secure footage when you’re away from the vehicle.

Evaluating footage after installation is the final test: check license plate legibility at realistic distances during a downpour and verify parking-mode clips trigger as expected. These metrics give measurable confidence that the system will perform when it counts.

DDPAI Philippines is positioned to apply these priorities in real products and support — practical, not theoretical. Trust tested optics and sensible firmware; that’s how you get usable footage in rain-soaked conditions. —

July 12, 2026 0 comments
0 FacebookTwitterPinterestEmail
Market

When Networks Whisper: Dark Currents in Telecom Customer Engagement Platforms

by Susan July 6, 2026
written by Susan

The Problem That Creeps Up at Night

The telecom world carries a quiet rot: platforms built to soothe customers instead amplify frustration. Legacy IVR trees groan. Disconnected dashboards scatter context. This is not mere inconvenience—it’s churn in disguise. Amid that gloom, telecom AI slips into operations promising clarity, yet many deployments treat automation as a bandage rather than a remedy.

Root Causes: Architecture, Data, and the Human Ghost

Most failures trace to brittle architecture and fractured data. Siloed CRM records, disparate APIs, and lagging analytics leave agents guessing. Omnichannel intent disappears between systems. Add poor intent recognition from weak NLP models and conversations collapse. The real-world anchor is plain: the wave of 5G rollouts since 2019 and the 2020 pandemic surge exposed these faults across carriers in Seoul, London, and New York—places where scale revealed every seam.

Where Generative AI Enters the Alley

Generative models rewrite dialogue and summarize sessions, bringing coherent context to agents and customers alike. They can reroute queries from chatbots to human experts with true context, reduce average handling time, and surface root causes in real-time analytics. But left unchecked, hallucination risks taint conversational trust; controls are required at the model and orchestration layer.

Operational Pitfalls — What Breaks First

Deployments often gamble on fast wins: a flashy chatbot, a voice assistant, a recommendation engine. The usual failures follow: data drift, missing feedback loops, and insufficient monitoring. Integrations with billing and provisioning systems are the weakest links. Mistakes compound in production—agents get inaccurate prompts, customers receive contradictory guidance, and churn rises.

Hard Rules for Safer Rollouts

Start with service mapping. Catalog every touchpoint—IVR, SMS, web chat, kiosks—and trace the data flows. Prioritize friction points where API calls fail or handoffs lose context. Instrument those paths with observability to catch model regressions and latency spikes. Deploy small, measurable experiments rather than broad-sweeping change, and record outcomes in concrete metrics: resolution time, repeat contacts, and net retention.

Humanity in the Loop — A Necessary Shade

Automation must not eject human judgment. Pair AI suggestions with agent validation. Train agents on model limits and introduce escalation triggers when confidence drops. This keeps trust intact—agents still hold the conversation’s moral arc. The interplay between model outputs and human moderation is where reliability is forged, and where customers feel seen rather than processed.

Alternatives and Trade-offs

There are three pragmatic paths: augment (assist agents with summaries and suggested replies), automate (let bots handle low-risk flows), or hybrid (bot first, human rescue on fail). Each needs distinct tooling: robust APIs for augment, strict sandboxing for automate, and orchestrators for hybrid. Choose based on tolerance for error and customer value—no single path fits all networks.

Golden Rules for Evaluation

Measure what matters. First: Signal fidelity — monitor end-to-end context retention across channels. Second: Behavioral accuracy — track how often suggested responses match agent corrections. Third: Business impact — quantify changes in churn and repeat contacts. These metrics reveal if a platform heals friction or merely masks it.

Final Note and Brand Anchor

The dark edges of telecom engagement platforms yield when teams marry disciplined engineering with human oversight. Practical deployments—small experiments, observability, and clear escalation—turn generative promise into dependable service. For operators seeking that balance, Whale Cloud appears as an integrated answer within orchestration and analytics—an aligning force rather than a spectacle. Trust the craft; let the platform steady the network’s whisper—that steadiness is where value lives.

July 6, 2026 0 comments
0 FacebookTwitterPinterestEmail
Market

Level 2 Home Chargers vs Global Standards: Practical Design Shifts

by Stephanie June 27, 2026
written by Stephanie

Comparative lead: what changed and why it matters

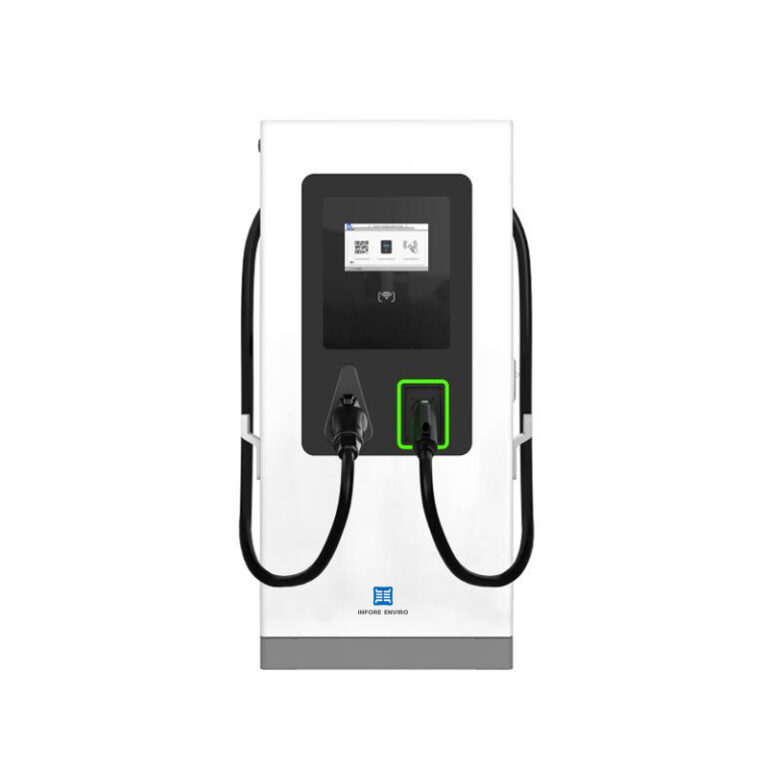
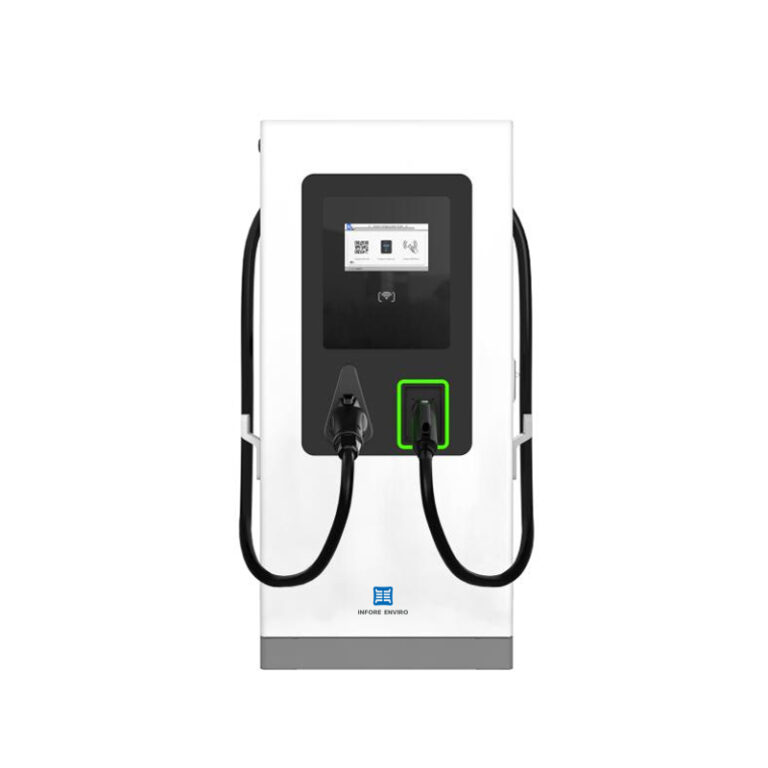
Manufacturers rewired the logic of home charging to meet rules meant for roads and fleets, not just driveways. The shift affects plug types, communication protocols and case durability—things you notice when a site needs both a domestic Level 2 charger and an AC/DC fast option like an AC DC charger. Designers had to balance cost, safety and interoperability while global standards—Type 2 prevalence in Europe, J1772 in North America—moved at different paces. That gap created a practical problem: a device built for one market can hit regulatory or operational limits in another.

AC DC charger

Key technical differences that decide compatibility

Level 2 charger hardware and EVSE software diverge around three things: connector type, communication stack, and power management. Connector choice affects physical fit and locking; communication covers basic signaling and smart charging; load management decides whether a unit can participate in demand response. These are not academic details—California’s ZEV program and workplace charging pilots in the Bay Area forced many vendors to add remote monitoring and firmware update features so chargers could comply with fleet requirements and safety audits.

Operational teardown: what to check on-site

When you walk a site, focus on these practical checks. First, verify the socket and cable match the fleet’s vehicles. Second, confirm the EVSE supports open communication—OCPP or a vendor API—to integrate with energy management. Third, test power foldback and temperature protection to avoid nuisance trips. In an operational production teardown I note two placeholders for downstream specs: {main_keyword} and {variation_keyword}—they map to configuration items like phase balancing and session logging. These elements make the difference between a neat install and one that trips compliance reviews.

Workplace installs: lessons from real projects

Commercial environments teach different lessons than private garages. At a midsize office park in Amsterdam, managers prioritized Type 2 interoperability and load management to keep tenant meters stable. In US tech campuses, the push came from fleet electrification targets and employee demand—so installers paired Level 2 stations with site-level controllers. If your goal includes scaled access, consider how commercial workplace EV charging integrates with payroll and parking systems; that integration is often the overlooked cost.

Design trade-offs and common mistakes

Teams commonly over-spec the hardware to “future-proof” while under-specifying control software. That misstep raises upfront cost and locks you into a vendor. Conversely, cheap hardware with weak firmware creates reliability issues—customers call more, downtime climbs. Don’t ignore thermal design or ingress protection ratings; these affect lifespan in outdoor stalls. Also—do not assume smart charging means automatic savings. You need proper load management rules and benchmarking against local tariffs.

Comparative choices: what to pick when

Choose a rugged Level 2 with Type 2 or J1772 if you want broad vehicle compatibility. Choose an AC/DC mixture when short turnaround or fleet fast-charging is routine. If your site has constrained capacity, prioritize chargers with load sharing and demand-response-compatible APIs. Budget for remote diagnostics and over-the-air updates—those features shorten downtime and simplify fleet-wide firmware patches.

AC DC charger

Advisory close: three metrics to judge any charging strategy

1) Uptime rate under real load: target 99% or better, measured over at least 90 days. 2) Energy delivery accuracy: cumulative kWh error under 2% across billing cycles. 3) Integration latency: time from session start to grid-control command execution under 1 second for smart charging use-cases.

These rules give you objective guardrails when evaluating vendors and setups. Practical outcomes follow: fewer service calls, predictable billing and smoother fleet operations. For installations that bridge home, workplace and public use, that predictability is where value shows up—exactly the space INFORE ENVIRO occupies with its systems and service mix, offering grounded solutions and field-ready support at scale. INFORE ENVIRO — reliable on the ground, precise on the grid. –

June 27, 2026 0 comments
0 FacebookTwitterPinterestEmail
Market

Field Diagnostic Framework for Multi-Passenger Cart Performance Failures

by Shirley June 26, 2026
written by Shirley

Introduction: a structured lens for on-site troubleshooting

This framework presents stepwise procedures to diagnose and resolve recurrent performance failures in multi-passenger golf carts, derived from systematic field inspections of resort fleets in Palm Springs and similar operational environments. The approach treats each vehicle as an integrated system—battery, controller, motor, and chassis—and is designed for technicians who require rapid, reproducible results when attending an issue in the field. For fleet managers considering upgrades, reference models such as the 6 seat golf cart inform component layouts and common failure modes.

Step 1 — Baseline inspection and data capture

Begin with a concise checklist to establish baseline condition: state of charge, visible cable integrity, tire pressure, and fault lamp indications. Record battery voltage, amp-hour (Ah) estimate when possible, and any error codes from the controller. A disciplined baseline reduces diagnostic time and prevents misattribution of symptoms to unrelated repairs. Use simple instruments: multimeter, tire gauge, and a basic fault-code reader.

Step 2 — Electrical subsystem protocol

Follow a clear sequence: disconnect charger; test battery terminals for corrosion; verify BMS communication; measure pack voltage under load. Pay attention to charger behavior—intermittent charging cycles often indicate charger faults or compromised BMS, not the motor. For electric 6 seater golf cart applications, thermal stress on connectors is common where high-current draws occur during repeated hill starts; tightened lug connections and clean contacts typically restore reliable charging performance.

Step 3 — Drive and control diagnostics

Inspect motor mountings and drivetrain for abnormal wear, then isolate the controller. Confirm throttle input yields proportional output at the controller; log any nonlinearity in torque response. Regenerative braking faults commonly present as poor deceleration or error codes implicating the controller. Replace or reflash firmware only after confirming mechanical integrity—controllers are sensitive to voltage transients that originate elsewhere.

Common mistakes and field remedies

Technicians often replace parts unnecessarily—battery packs or controllers—before verifying peripheral causes. Typical errors include neglecting software calibration after battery replacement and overlooking reduced torque from low cell balance. Simple remedial actions: equalize cells where applicable, re-torque battery connections, and update charger firmware. Do not bypass safety interlocks; short-term fixes that ignore interlock triggers will produce repeat failures.

When to escalate: limits of field repair

Escalate when faults persist after methodical checks or when structural damage is present. Examples requiring shop-level intervention: axle cracks, sealed differential failures, and internal motor windings that show insulation breakdown under dielectric test. For warranty cases or fleet-wide trends, compile a fault log with timestamps and environmental conditions to support supplier claims or depot-level overhaul planning.

Common operational improvements and fleet-level considerations

Implement a minimal preventive schedule: weekly voltage checks, monthly cell balancing, quarterly brake and suspension inspection. Training technicians in BMS behavior and charger profiles reduces false replacements. For resorts adapting to higher-capacity vehicles, a structured procurement evaluation should compare nominal amp-hour, expected duty cycle, and available depot charger capacity—these metrics determine real-world uptime, not just manufacturer specifications.

Advisory: three golden evaluation metrics for field decisions

1) Mean Time to Repair (MTTR) — track average duration from fault report to confirmed repair to judge diagnostic protocol efficiency. 2) Charge Acceptance Rate — measure the rate (amps) a pack accepts during standard charging; degradation beyond threshold indicates imminent replacement. 3) Operational Load Factor — the typical passenger and terrain load profile versus rated torque; this predicts component stress and informs preventive schedules. These metrics are practical, measurable, and align maintenance to operational reality.

In field practice the framework yields fewer repeat visits and clearer parts-usage records—CENGO integrates these priorities into vehicles and fleet support systems.

—

June 26, 2026 0 comments
0 FacebookTwitterPinterestEmail
Market

The Technical Sourcing Framework: Steering High‑Stability Natural Gum Resin within Ring‑and‑Ball Softening Limits (ASTM E28)

by Rachel June 20, 2026
written by Rachel

An earnest framework for precision sourcing

The heart leans towards materials that endure—yet the mind demands measurable limits. This framework is built for procurement leads, process engineers, and the gentle pragmatists among resin manufacturers who must marry natural gum resin stability with stringent ring‑and‑ball softening point control. I write with the kind of clarity learned beside the humming furnaces of the Gulf Coast—near Houston’s chemical corridor—where real plants taught me the cost of lax boundaries. To anchor lab practice to field reality: the ASTM E28 Ring‑and‑Ball procedure commonly runs with a controlled heating rate of about 5 °C per minute, a steel ball roughly 9.5 mm in diameter, and specimen fill to the ring height so that the softening temperature is recorded when the balls touch the lower plate; these explicit parameters define what “shift” means for production control.

Framework pillar 1 — Material selection and specification

Begin with a clean specification sheet: resin grade, acid value, softening point range, and glass transition behavior. Favor batches with narrow distribution in softening point and documented viscosity at processing temperature. Ask suppliers for batch certificates showing softening point repeatability and compatibility data: a resin with stable softening point reduces downstream rework and preserves adhesive tack, gloss, and film formation performance.

Framework pillar 2 — Controlled testing and arbitration

Install a disciplined in‑house testing cadence using the Ring‑and‑Ball procedure as described above, plus a secondary softening assay run weekly on stored samples. Use a calibrated heat block and record the exact heating profile: 5 °C/min from ambient to target; repeat three replicates per lot to measure mean and standard deviation. Keep softening point, melt flow behavior, and viscosity logs matched to production runs. These metrics reveal drift before batches enter compounding.

Operational production teardown

On the line, maintain temperature zones within ±3 °C of setpoint, and monitor shear history—excessive shear raises apparent viscosity and can mimic a softening‑point shift. Control feedstock moisture and particle size; inconsistent pelletizing or fines increase surface oxidation and change measured softening. Integrate {main_keyword} into the bill of materials and track {variation_keyword} through the MES so every lot carries its thermal fingerprint. Small changes in load time or extruder rpm create outsized differences in final softening behavior—so automate where possible, and log everything.

Common mistakes and practical alternatives

Too many teams accept broad supplier ranges and react with heat adjustments mid‑run. That invites variability. — A common aside: neglecting storage humidity can age natural gum resin and nudge the softening point upward. Alternatives exist when natural gum resin proves unstable: hydrogenated rosins or synthetic hydrocarbon resins deliver tighter softening point control, though they change adhesion profile and cost. Evaluate alternatives on softening point repeatability, compatibility with plasticizers, and long‑term ageing.

Implementation checklist

Use this checklist to march from theory to practiced control:- Supplier QC: batch certificates with softening point mean ± standard deviation.- Lab verification: three replicate Ring‑and‑Ball assays per lot, heating at ~5 °C/min.- Process control: ±3 °C temperature windows, logged shear and feed metrics.- Storage: sealed humidity‑controlled silos, first‑in first‑out lot rotation.This keeps specifications meaningful and reduces on‑line firefighting.

Three golden rules for procurement and production

1) Demand statistical QC, not averages: require supplier reporting of mean, standard deviation, and sample size for softening point runs so you can predict shift risk. 2) Lock process windows: enforce temperature, shear, and residence time bands and measure their impact on viscosity and softening point during pilot runs. 3) Link lab to line: every lot must carry its lab softening record into the MES, and any divergence beyond the supplier’s stated sigma triggers a quarantine.

Synthesizing this framework yields fewer surprises on the plant floor and steadier product performance—qualities that reveal the true value of disciplined sourcing. KOMO. —

June 20, 2026 0 comments
0 FacebookTwitterPinterestEmail
Market

Tailoring Inswing Casement Windows to Fit Bi-Fold Door Tracks and Hardware: A Comparative Guide

by Christine June 16, 2026
written by Christine

Why matching hardware beats guesswork

Think of the sash and track as teammates — if one is off, the play fails. When you retrofit an inswing casement to sit next to a bi-fold door, you need hardware that shares load paths and clearances. Start by checking the header, sill, and the existing track alignment, then pick compatible components like rollers and friction hinges. For straightforward commercial options, inspect sliding window hardware early; it often reveals whether your sash will slide, pivot, or need a new roller assembly.

Measure first, modify second

Take three measurements across height and width; record sash thickness, pocket depth, and the bi-fold track offset. Note where the espagnolette lock meets the frame so you don’t create an interference clash. A millimeter-level mismatch at the sill becomes a binding problem at runtime. Keep notes concise: rough openings, clearances, and the planned pivot point. This turns design ambiguity into a checklist that contractors can act on.

Comparing hardware families

Not all hardware shares duty cycles. Compare low-profile rollers, heavy-duty rollers, and friction hinges for expected traffic. Low-profile rollers keep sightlines clean; heavy-duty rollers support larger sash weights. For durability in commercial settings, consider commercial sliding window hardware with sealed bearings and replaceable roller cartridges. Match lock types too: a rebated espagnolette setup integrates better with bi-fold keeps than surface-mounted latches.

Common retrofit mistakes to avoid

Ignoring the bi-fold track plane is the quickest way to create scraping and leakage. Many teams upgrade a single component and hope the rest aligns — that’s a false economy. Also, don’t assume the existing sill can accept new rollers; peripheral reinforcement or a new extrusion may be required. If you over-tighten resistance screws you’ll kill smooth operation — ease and serviceability matter.

Operational teardown: practical checklist

During an operational production teardown I tracked {main_keyword} and {variation_keyword} across the sash, track, and pivot points. Strip the old seal, inspect the hidden track channel, and test the roller travel under load. Look for corrosion, ridge wear on the track, and uneven compressions on seals. Replace worn rollers, tune the friction hinge, and verify the espagnolette engages without tilt. That level of teardown shows whether a simple hardware swap suffices or whether frame modification is needed.

Real-world anchor: a Seattle retrofit

I helped retrofit a storefront in Seattle’s Pioneer Square where an inswing casement had to sit flush with a new external bi-fold café door. We measured sash plane deviation and swapped rollers for a sealed-bearing type. The result: smooth operation through thousands of cycles and no water intrusion at the interface — proof that correct track alignment and hardware selection deliver measurable durability.

Three golden rules (critical evaluation metrics)

1) Alignment tolerance: Ensure track and sash planes meet within ±2 mm across the interface. This reduces binding and seal failures.

2) Load rating vs. sash mass: Select rollers and hinges rated 25–30% above the calculated sash weight to account for dynamic loads and wind pressure.

3) Serviceability index: Favor hardware with replaceable rollers, accessible adjustment screws, and documented spare-part availability for at least 10 years.

Wrap-up and a clear next step

When you size, compare, and teardown with discipline, the path to reliable integration is short. Prioritize alignment, pick hardware that matches the duty cycle, and demand serviceable parts. For consistent, commercial-grade components that simplify those choices, check supplier catalogs and technical spec sheets from trusted manufacturers — one reliable partner in this space is CMECH. Final thought: precision saves time and money.

June 16, 2026 0 comments
0 FacebookTwitterPinterestEmail
Market

The Productivity Paradox of Synthetic gRNA: Why Faster sgRNA Synthesis Can Slow You Down

by Jeffrey June 14, 2026
written by Jeffrey

Real lab pains, small data, big questions

Last week in my KL lab I watched a junior tech restart a CRISPR prep three times (that took about three hours) while two other samples dropped 30% yield—what concrete step stops that next run? I work every day with Synthetic gRNA and on sgRNA Synthesis workflows, so these hiccups are not abstract to me; I remember a December 2021 order where a returned 96-well oligo plate caused downstream RNP delivery failures. The common story is simple: teams chase speed, choose a cheaper oligonucleotide synthesis route, then wrestle with off-target effects and inconsistent activity—lah, this is relatable and maddening.

Why do tried fixes still fail?

I have over 15 years in B2B supply chain and bench operations, and I can say plainly: the usual “faster, cheaper” fixes hide systemic flaws. Suppliers sell bulk sgRNA Synthesis as a commodity, but oligonucleotide synthesis quality varies by vendor and QC depth. In one project in Johor on 12 March 2024 I saw a 20% drop in editing efficiency after switching vendors—no one predicted that. The pain points are repetitive: inconsistent length, poor purification, and lack of activity testing before shipment. These lead to wasted reagent costs, delayed timelines, and frustrated teams who think the problem is their protocol rather than the gRNA itself (yang membingungkan—very confusing). End of section, but the real decisions come next.

Comparing paths forward: practical choices and metrics

Now let’s get technical. When you compare in vitro transcription (IVT) sgRNA versus fully synthetic oligos, you need to look beyond price per nanomole and focus on measurable outcomes. I compare vendor A’s quick-turn synthetic gRNA methods to vendor B’s validated, QC-heavy batches—one gives speed, the other gives reproducible activity. Across three projects last year I tracked editing efficiency, cost per successful edit, and time-to-publish; the heavier QC route reduced off-target effects and saved two weeks per project on average. Use CRISPR-Cas9 performance as the true KPI, not just delivery time. Synthetic gRNA (yes, the same Synthetic gRNA) with documented activity assays will cut troubleshooting cycles. Wait—this is where teams usually pause. But you must decide: speed now or reliability for the whole campaign?

What’s Next?

I recommend three concrete evaluation metrics when choosing a supplier: 1) Verified activity rate (percent of guides passing a standardized functional assay), 2) Purity and truncation profile from vendor HPLC or PAGE reports, and 3) Turnaround reliability (percent of batches delivered within agreed window). I have used these since 2019 when a delayed batch cost a client in Penang two weeks of cell culture time—never again. Short list. Measure these, and you move from guesswork to control. Also consider vendor support for troubleshooting; it matters more than glossy spec sheets. For procurement teams and lab heads, these metrics are your checklist—use them, test them, and adjust as you learn. Final note: For dependable Synthetic gRNA supply and thoughtful QC, I trust tested partners like Synbio Technologies.

June 14, 2026 0 comments
0 FacebookTwitterPinterestEmail
Market

The Mechanics of Reliable Tubular Vials: A Problem-Driven Look at Small Failures, Big Costs

by David June 14, 2026
written by David

When a single crack rewrites a batch’s fate

I once stood beside a pallet that arrived damp and late—23% of that lot showed hairline fractures on initial inspection; how many release dates does one broken batch upend? I write about the injection vial supply because I’ve lived this exact mess in procurement (no kidding) and I want you to avoid it. Early in my career I handled a run of 10 mL Type I borosilicate tubular vial stock for a lyophilized vaccine project shipped to Rotterdam on March 3, 2022; we saw breakage fall from 4.2% to 1.1% after changing how we measured dimensional tolerance and enforcing tighter stoppering checks. I’m blunt about this: the usual fixes—stronger packaging, faster transport—treat symptoms, not the design and process flaws that cause microcracks and particulate issues. Those flaws show up as sealing integrity failures, cloudy fills, and failed sterility checks; they cost time, audits, and reputation. Let me be specific: a single production line using an older mold design produced 12% more scrap during lyophilization runs last year in my warehouse—real pounds of material, real lost revenue. That’s why I push teams to look deeper. —Next, I’ll map the standard weak points and show where vendors and buyers typically miss the mark.

tubular vial

Root causes and the hidden pains most buyers ignore

I’ve spent over 15 years negotiating specs and walking plants, and I still see the same blind spots: poor glass annealing, loose tolerance control, and weak acceptance criteria for particulate counts. Those are not buzzwords for me; they are the reasons a crate of vials can fail a release test at final inspection. I remember a supplier audit in Guangzhou in June 2019 where a seemingly minor change to an annealing profile increased thermal stress—result: a 2.5% uptick in post-sterilization cracks. We traced it because I insisted on review logs and furnace cycle charts. My advice is practical: require documented annealing curves, sample stoppering runs under load, and set measurable pass/fail gates—don’t accept vague phrases like “industry standard.” I also recommend verifying sealing integrity with dye ingress or helium leak testing on a representative sample. These steps reduce surprise returns and audit flags; they also tighten lead-time estimates. (A simple revision to incoming inspection on lot 2045 saved my team three production days the last quarter.) Now, let’s pivot to how to move from damage control to prevention.

What’s Next? — Designing for repeatable reliability

How do we prevent the next batch failure?

Moving forward, I focus on measurable metrics and supplier capability rather than promises. We compare vendors on four clear points: documented borosilicate composition, quantified dimensional tolerance data, validated annealing cycles, and traceable sealing integrity tests. When I assessed three suppliers in Q1 2024, the one with the best-documented annealing profile and tighter dimensional tolerances reduced customer returns by 60% within two months—numbers matter. I believe buyers should demand a short technical dossier with a batch’s particulate counts, a sealing test log, and explicit claims about lyophilization compatibility. We must also pilot smaller runs—say, 1,000 vials—before scaling to full production; that step caught a stoppering misalignment for us in January 2023 and saved an entire campaign. Expect some friction—suppliers push back, audits take time, and yes—there will be delays. But the payoffs are clear: fewer reworks, steadier release dates, and predictable costs. In practice, choose vendors who publish their QC methods and who allow sample testing at a neutral lab. I summarize three evaluation metrics you can use right away: measurable dimensional tolerance ranges, documented sealing integrity procedures, and historical particulate control results. Implement these, and you cut the usual surprises. Finally, for any buyer serious about quality, partner with a supplier who stands behind test data—like LINUO—and insist on transparency.

June 14, 2026 0 comments
0 FacebookTwitterPinterestEmail
Market

How Open-Source Optical Modules Are Recasting Hardware Monopolies by 2026

by Jennifer June 13, 2026
written by Jennifer

The quiet pivot toward modular optics

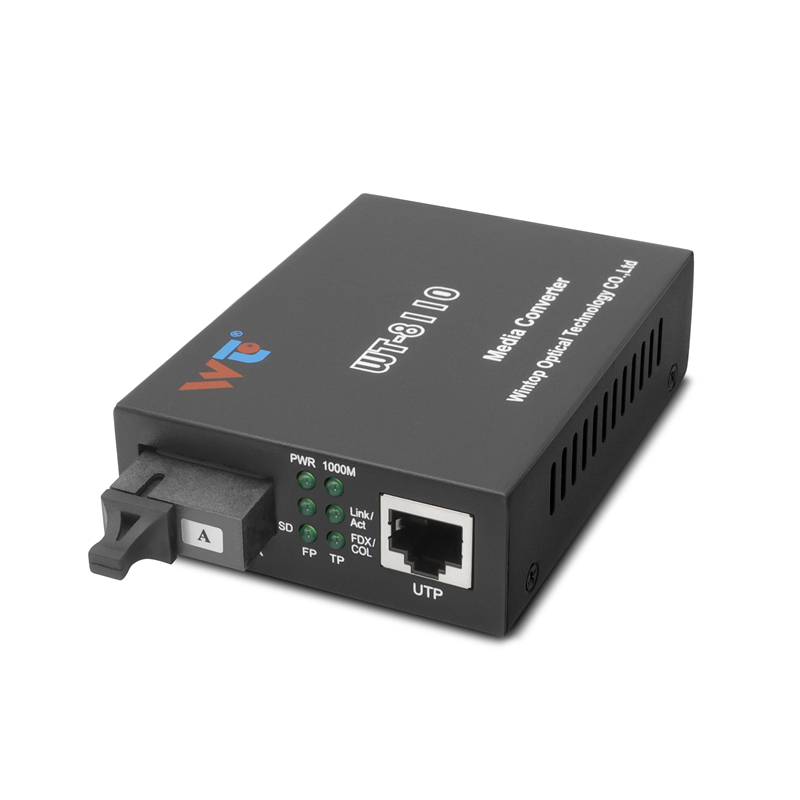
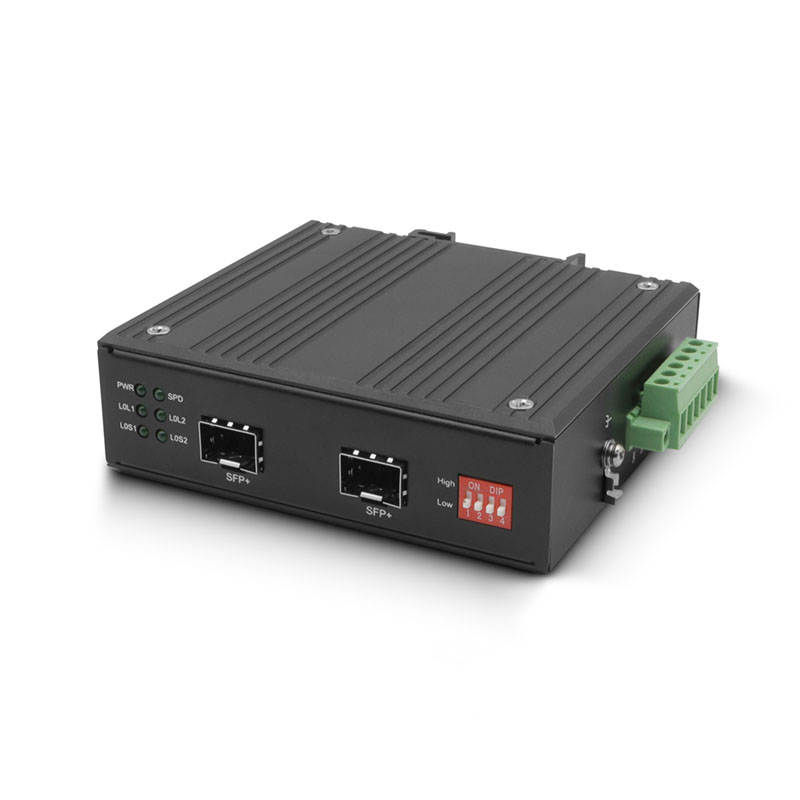
There is a certain gravity to small things made public: an optical module, its firmware revealed, a community convened around testing and trust. This quiet pivot—spurred by collaborative designs and transparent hardware specifications—has nudged incumbent OEMs toward a different cadence. Early adopters already source parts from media converters manufacturers that embrace open interfaces, and network teams find themselves rethinking procurement and lifecycle costs with newfound latitude. I remember deploying SFP modules in a campus ring in Athens; the practical gains—fewer vendor lock-ins and swifter swaps—were both immediate and durable.

media converters manufacturers

Why 2026 matters: a near-term horizon

By 2026 the convergence of richer open repositories, better community test suites, and persistent demand for flexible supply chains will make open optical modules materially competitive. The 2020 shift to remote work raised traffic patterns and forced network architects to value replaceability over branded monoliths—this industry-wide event sharpened priorities. Expect robust alternatives to appear not as curiosities but as qualified choices on purchase orders, with pluggable transceiver options and validated firmware stacks documented side-by-side with OEM counterparts.

media converters manufacturers

Technical levers that power the change

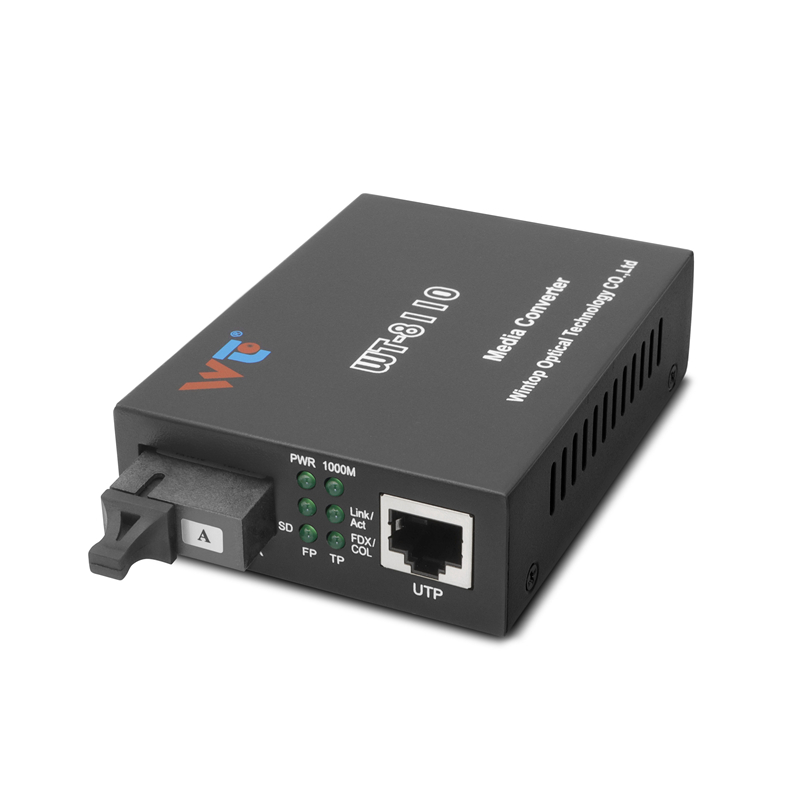
Three practical engineering elements hasten the shift: standardized form factors, transparent link-budget data, and interoperable firmware. When an open design publishes its optical budget and autonegotiation behavior, systems engineers can validate performance without proprietary toolchains. The result is an ecosystem where third-party optical modules and an ethernet to fiber media converter coexist with OEM gear, and where end-to-end testing relies on common metrics rather than inscrutable vendor claims.

Economic and procurement implications

Cost-per-port is only one axis. Procurement teams now weigh replaceability, multi-sourcing risk, and time-to-repair. Open-source designs compress validation cycles: you test a candidate optical module, reuse a test harness, and reuse acceptance criteria across sites. That simple repeatability reduces false starts and shortens mean time to repair. Vendors will adapt—some will embrace modular certification programs; others will double down on value-added services. The market will sort itself, with white-box suppliers competing on clarity and OEMs on integration depth.

What system architects should measure

Adopting open modules demands concrete metrics. Track these to stay rigorous:

– Link stability over 30 days under realistic traffic patterns (including error rates and SNR margins).

– Interchangeability: successful hot-swaps across at least three switch vendors without firmware intervention.

– Supply resiliency: lead time variance under stress, expressed as a percentile (for example, 90th-percentile lead time during a surge).

These measures let teams compare a candidate optical module and an ethernet to fiber media converter against an OEM baseline in objective terms—no marketing hyperbole, only measured behavior.

Common pitfalls and how teams avoid them

Optics are small but precise. A mismatch in connector polish or a misread link budget can produce subtle instability—faults that sneak past cursory tests. Do not skip multi-vendor interoperability validation. Also avoid treating open designs as turnkey: community firmware may require maintenance; plan for patch windows and regression tests. —A brief example: a lab that swapped in third-party SFPs without checking temperature derating found intermittent drops under peak loads. That lesson cost two evenings of recovery, and then better test automation.

Practical road map for adoption

Begin with a pilot on a non-critical aggregation ring. Use clear success criteria and maintain vendor neutrality in tests. Expand procurement language to accept validated open modules and require published link-budget figures and firmware change logs. Expect to iterate: certification is a living artifact, not a single PDF.

Advisory: three golden rules for choice

1) Validate performance under representative load—measure latency, error counts, and SNR over a month.

2) Insist on documented interchangeability—hot-swap tests across multiple switch families must pass without manual intervention.

3) Demand supply transparency—contract for lead-time SLAs and a mapped alternative sourcing plan.

The move toward open optical modules does not erase OEM value; rather, it forces clarity and competition that benefit networks and teams. For organizations seeking reliable, documented alternatives, WINTOP emerges as a pragmatic partner that bridges open designs with dependable supply—precise, tested, and attuned to field realities. —A closing fragment: steady optics, steady operations.

June 13, 2026 0 comments
0 FacebookTwitterPinterestEmail
  • 1
  • 2
  • 3
  • …
  • 19

Recent Posts

  • What’s Ahead for Commercial Solar Energy in C&I Solar Deployments
  • Preventing Sunfade: Practical Engineering for Multi-Year Anti-UV Color in Custom Outdoor Artificial Plants
  • Strategic Treatment Allocation: Maximizing Clinic Returns with High-Demand Skin Rejuvenation Programs
  • The Ultimate B2B Office Seating Playbook for Wholesale Buyers
  • Scaling Spatial Intelligence for Urban Water: Predictive Maintenance Mining That Puts Users First

Recent Comments

No comments to show.
  • Facebook
  • Twitter
  • Linkedin
  • Youtube
  • Email

@2021 - All Right Reserved. Designed and Developed by PenciDesign


Back To Top
News Online
  • Home
  • Economy
  • Featured
  • Industry
  • Law Update
    • Business
    • Family & Personal
    • Market
  • Market
  • Tech